But, as you can see from the following chart (click to enlarge), GDP growth in those quarters was driven substantially by changes in inventories.
 Absent those inventory changes, real GDP would have grown only on the order of about 1.8% and 1.5%, respectively --- hardly a vibrant bounceback of domestic demand from the sharpest recession since WWII, particularly given the degree of stimulus injected into the economy.
I'll ignore monetary stimulus for now, focusing on fiscal stimulus.
The contribution of the federal government's spending to GDP growth shown in the chart above gives an incomplete assessment of the goverment's true impact on GDP, as the other components are impacted by transfer payments, tax changes and the like. A much better measure is given by accounting for changes in the federal deficit.
The federal deficit grew nearly $1 trillion from 2008 to 2009, and is projected to grow a further $143 billion in 2010.
 So GDP shrunk 1.3% in 2009 despite $954 billion of extra spending by the Obama administration in 2009 relative to 2008 (a deficit of 10% of GDP, up from 3.2% in 2008).
The deficit is projected by the government to grow further in 2010, accounting for almost 40% of the projected growth in nominal GDP. The deficit is then anticipated to fall in the succeeding 3 years.
 Meanwhile, the government projects 2.6% growth in nominal GDP this year, followed by 4.6% growth next year, and 6% growth in each of the following 2 years.
These growth projections are made despite the fiscal retrenchment of 19% (of the previous year's deficit) in 2011, 35% in 2012 and 12% in 2013 (equivalent to 2.0%, 2.9% and 0.6%, respectively, of GDP).
 Meanwhile, the impact of the American Recovery and Reinvestment Act of 2009 is waning.
The total stimulus included in the ARRA is $787 billion: Also shown as (from recovery.gov):
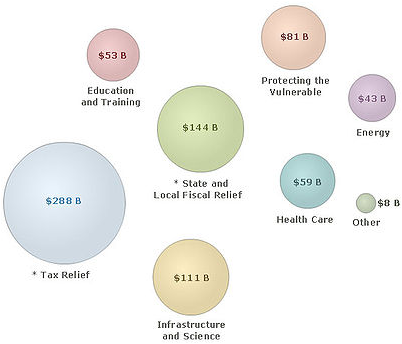
Solid data on the timing of fiscal stimulus due to the ARRA is hard to come by. The best guide I could find that projects into the future was provided by Mark Zandi of Moody's Economy.com.
As the following chart shows, the projections he made (in spring 2009) have substantial stimulus throughout 2010, but the stimulus will have peaked in the first quarter.
 According to the government, $410 billion, or 52% of the allocated stimulus of $787 billion, has been spent so far ($163 billion of the $288 billion allocated for tax benefits; $115 billion of the $275 billion allocated for contracts, grants and loans; and $132 billion of the $224 billion allocated for entitlements.)
Through the first quarter, $373 billion had been spent, as shown here:
 So $110 billion was spent in the first quarter, up from $84 billion in the previous quarter --- but GDP growth decelerated from 5.6% to 3.1%, and absent inventories from 1.8% to just 1.5%.
As Zandi projected, the positive contributions to real GDP growth are just about done, and will turn negative in H2.
 So, though, as per above, the White House is projecting a bigger deficit in 2010 than 2009, which adds to GDP growth YoY, that will be front-loaded, with H2 relying on private demand for growth.
And there will have to be enough growth to offset the continued declines to be expected from state and local governments. State and local government spending is about 50% bigger than federal government spending ($1.5 trillion vs. $1.05 trillion).
And state and local governments have already been detracting from GDP growth --- negative growth in 5 of the last 6 quarters, including the last 3, down 0.6%, 2.2% and 3.9% QoQ annualized, subtracting 0.1%, 0.3% and 0.5% from total GDP growth.
Double-dip? I think so.
Double-dip? I think so.
No comments:
Post a Comment