Pages

Showing posts with label stocks. Show all posts

Thursday, August 19, 2010

Bubble Bubble Toil and Trouble?

Lots of talk out there these days about bonds being in a bubble.

Notable example: Mr. Stocks for the Long Run, Jeremy Siegel, thinks bonds are in a bubble.

In fact, he thinks that those "who are now crowding into bonds and bond funds are courting disaster". His version of disaster is that bonds could lose 3x their current yield, or about 8% or 9%.

Never mind that if you hold to maturity, you will not lose money (like you can when an equity market bubble bursts), you will receive your coupon payments and get your full principal back.

Siegel is the guy who in January said:
I don't see it being a good year [for bonds] in 2010, because the Fed will be forced to raise interest rates sooner rather than later. We will see bond rates move higher.
Well, he was right... for a time. The 10-year yield did indeed move higher from just above 3.6% at the time of his interview to nearly 4% in April.... but have now rallied to under 2.6%.

Nor will he will be right about the Fed.

And he thinks that the p/e multiple should be at around 20 times normalized earnings "because of efficiencies in the market".

At no time in history when the stock market has had a 20x normalized P/E did you end up with an attractive long-term return on a going-forward basis. Normalized P/Es have exceeded 20 in the 1900s, the late 1920s, the 1960s and the 1990s; and we know how the following decade turned out in each case.

Consider the following chart, which shows what average and median price returns were 10-years forward from experiencing a normalized P/E in each range (using data going back to 1900)

anything over 18 has been hazardous to your wealth; would you accept a (nominal) return on stocks of just 1-4%?

by the by, the normalized P/E on the S&P right now is at about 22

so, he thinks bonds could lose as much as 10% if yields go higher; what does he think stocks might lose?

well, he doesn't say; but the normalized P/E of its high level currently of 22 compares unfavourably to a historically average level of 17 or 18, implying that stocks are currently 25% to 35% over-valued

which perhaps explains why investors are willing to bid bonds up to current levels

I'd rather take on the relatively low probability (given the economic environment and the likely course of monetary policy, both traditional and unconventional/quantitative) of a potential 10% loss on bonds as opposed to the (in my estimation) higher probability of as much as a 30% loss on stocks.

Or, as Felix Salmon says,

Most bond investors would love nothing more than for the Jeremys to be proved right and for stocks to start rising impressively as the economy recovers — even if that means losing money on their bond investments. But if the economy gets worse, having your money in safe Treasury bonds is going to help you sleep a lot better than having it in risky and volatile stocks

but let's say that maybe Siegel is right in a sense; maybe the current level of yields IS unsustainable in the long run, and, as such, bonds ARE in a bubble; but perhaps its a VERY long run (Japan's bonds have been in a bubble for 15+ years, I guess, with no signs of it abating yet), and bonds are in an unpoppable bubble, as per Colin Barr of Fortune.

Or, as per the Pragmatic Capitalist, the great bond "bubble" is a myth.

Thursday, August 5, 2010

Stocks3: the futility of forward operating earnings estimates

As per an earlier post, the S&P 500 has bounced around in a very wide range in the last decade, from as high as 1576 to as low as 666. It is currently trading at about 1125, which is almost exactly in the mid-point of that range.

Recent index levels therefore provide little guidance regarding future direction: one might as well assume that stocks could tend towards their recent lows as to trend towards their past highs.

What is required, therefore, is a reliable measure of valuation.

Based on a price of 1125 and trailing-year operating earnings of $72.50, the market is trading at a price-to-earnings multiple (P/E Op) of 15.5. This compares favourably to the historical median P/E Op (using operating earnings data available since 1988) of 18.3 (i.e. the market appears to be 15% undervalued relative to this valuation norm since 1988).

Furthermore, based on forward operating earnings estimates of $82.77 for next year and $95.87 for the following year, the forward P/E Op of 13.6 and the 2-year forward P/E Op of 11.7 both suggest that the S&P 500 currently represents good value.

However, based on forward earnings estimates, the S&P seems always to represent good value! (irrespective of its price level). Since the end of 2005, the forward P/E has consistently been around 15 and the 2-year forward P/E around 13. At no time did those "valuation indicators" remotely suggest the possibility of either a price decline of 50%, nor, for that matter, of a rally of 80%.

Despite operating earnings having already risen 43% from their 2009 trough, analysts are projecting earnings growth of 14% in the coming year and 16% in the following year, for a cumulative rise of 32% over the next two years (and a rise of 89% from the trough).

The expectation of earnings of over $95 would eclipse the 2007 high of $91 --- which was established at a time when corporate profits accounted for their highest proportion of GDP since 1949; profit margins were historically very high; the economy, and particularly the financial sector, were excessively leveraged; unemployment was under 5%; retail sales were up over 5% year-over-year and establishing their peak level (5% above the level sales are currently at); when housing starts were double the current level and housing prices had just started to deflate; household net worth was at a record high, etc. All this is simply to suggest that analysts’ expectations are apparently predicated on a return to 2007-type economic “norms”.

In any case, analysts have established an un-enviably poor track record of projecting earnings. The following chart shows at each month-end over the last five years the level of trailing operating earnings and, at the same point in time, analysts’ estimates on a going-forward basis of forward and following year earnings.

While from the above it is clear that analysts have a tendency to simply “scale-up” the existing level of earnings, the following chart more clearly demonstrates how unreliable analyst forecasts have been (even for operating earnings, much less reported earnings). For instance, 3 years ago, in August 2007, analysts projected forward earnings of $96 and following year earnings of $107, but operating earnings as of August 2008 were under $70 and for August 2009 were under $40.

Furthermore, operating earnings have become further and further divorced over time from companies’ total reported earnings. In fact, the ratio of forward operating earnings to revenues is now higher than it has ever been. As John Hussman has said:

“Ultimately, the value of any security is the properly discounted stream of cash flows that the security will deliver into the hands of investors over time. It is very convenient for Wall Street to operate on the basis of "operating earnings" - which aren't even defined under Generally Accepted Accounting Principles (GAAP) - because this measure of earnings is detached from any need to properly deal with portions of earnings that are lost to writeoffs, "extraordinary" losses, option grants to insiders, and so forth. Yes, these items appear in net earnings, but to most analysts, it is apparently unimportant if companies repeatedly write off previously reported "earnings" as losses, or quietly divert them to incentive compensation - all of that is water under the bridge even if it occurs quarterly.”


So, though one may feel tempted to use operating earnings and operating earnings estimates as a guide for the sake of determining stock market valuation, one must recognize the flaws with such an approach given both the awful track record of analysts' earnings estimates and the significant and growing deviation between operating earnings and the true level of earnings available to shareholders.

Stocks2: S&P earnings growth

In an earlier post I showed that over the long-term, 10-year inflation-adjusted price returns for the S&P 500 and DJIA averaged low single-digits. However, that final chart was the only one I showed on a real basis; all else was shown on a nominal basis.

So, lest I be accused of throwing in an apple with a bunch of oranges, I'll show the comparable chart on a nominal basis here:


So, the picture looks little different: about 2% higher on a nominal basis, unsurprisingly, than on a real (inflation-adjusted) basis.


Another potential criticism of the previous post is that I used NIPA Corporate Profits as a proxy for S&P 500 earnings. Of course, these are two different entities, so may not bear a consistent relationship to each other. So, to redress that problem, I'll look at S&P earnings directly.

The point I was making in the last post is that corporate profit growth should and would, over the long haul, regress to approximately the same level as nominal GDP growth. I showed that with NIPA corporate profits that this was historically the case.

As the following chart shows, though there were deviations at times, S&P earnings growth has been reasonably well-correlated with NIPA corporate profit growth:

More to the point, as the following chart shows, S&P earnings growth has not generally kept pace with nominal GDP growth:

While there were certainly periods like the 1990s and 2000s when S&P earnings grew faster than GDP as profit margins improved, on average, the periods when S&P earnings growth trailed GDP growth dominated the periods when the converse was true.

So, to reiterate, to believe that stock prices should grow faster than nominal GDP growth is to believe either that corporate earnings growth can grow sustainably faster than GDP, which is contrary to historical evidence, and/or that P/E multiples will continuously expand, a topic that will be examined in a later post.

Monday, August 2, 2010

August 2

Valuing the S&P 500 Using Forward Operating Earnings. John Hussman.

stocks are a claim to a long-term stream of cash flows that will actually be distributed to investors over time, and that this stream of cash flows cannot be estimated from a single year's earnings number. The main reason for this is that profit margins vary from year-to-year over the business cycle, and tend to mean-revert over the long-term. Earnings (net and operating) tend to be depressed during periods of economic strain, but when they reflect compressed profit margins, they are strongly associated with above-average rates of subsequent growth over the following 7-10 years. In contrast, earnings that reflect elevated profit margins are strongly associated with poor rates of subsequent growth. When analysts take earnings figures at face value, and presume to "capitalize" them simply by dividing by interest rates, they demonstrate a Kindergartener's grasp of securities valuation......

the market was moderately, but not historically undervalued, at the 2009 low, which briefly approached the level of valuation that was observed at the 1970 low, but was nowhere close to the valuations seen at points such as 1950, 1974 and 1982. I clearly underestimated the willingness of investors to drive stocks back to strenuous overvaluation so quickly. Earlier this year, the market was more overvalued than at any point prior to the late-1990's bubble, and is currently near the same level of overvaluation as the 1972 and 1987 market peaks. At present, ... the S&P 500 is most likely priced to deliver a 10-year total return of roughly 6%, albeit with the likelihood of significant interim volatility. Stocks are emphatically not cheap on a historical basis.


Defining prosperity down. Paul Krugman, NYT.

Friday, July 30, 2010

Stocks1: What should the return on stocks be?

Should it be 10%?

If, like most investors around today, you started paying attention to the stock market in the 1990s, you might be excused for thinking so.

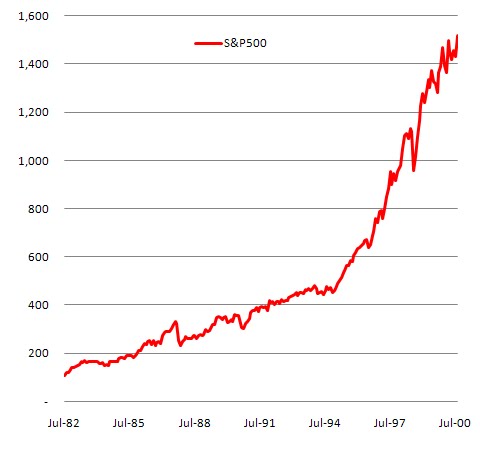
The 18-year equity bull market that started in 1982 and ended in 2000 saw the S&P 500 go parabolic, from about 100 to over 1500, for a cumulative gain in 18 years of a whopping 1317%, or an annualized return of 15.8%.

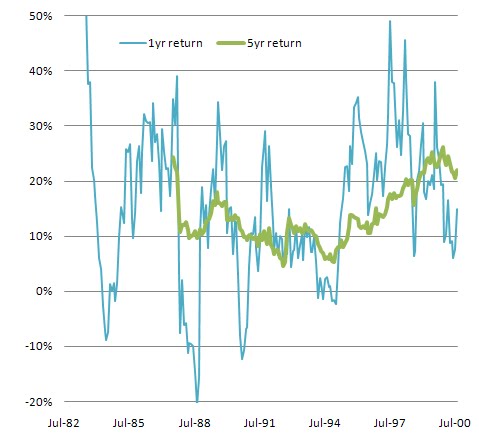
Though there were some dips along the way, most notably in October 1987, the market typically rallied back strongly, so though there was quite a bit of volatility in one-year price returns (based on monthly data, excluding dividends), from a low of -21% to a high of +52%, longer-term returns were always positive, and typically generously so, with five-year returns only falling as low as 5%, but going as high as 26%, and nearly always in double-digit territory.

But does that recent stock price history really tell us much about how stocks should perform? After all, why rely on the memory of the 1990s when in the 2000s we have experienced something entirely different, i.e. two wicked bear markets. From the March 2000 peak of 1550, the market got cut in half to the October 2002 low of 768. It then surged back to a new high in October 2007 of 1576, before again being cut by more than half to a low of 666 in March 2009.

One-year returns have therefore ranged from as low as -45% to as high as 50%, and five-year returns from -8% to +13%, but on the whole over that period, the market is down 29%, for an annualized return of -3%.
Clearly, we're not getting the 10%+ returns we became accustomed to!

But, frankly, why should we expect 10% anyways?!

Think of it this way: stock prices should go up commensurate with corporate earnings; and corporate earnings should go up commensurate with the economy. If the economy grew at 5% per year on average, if we were to expect stock prices to go up 10% a year, we must somehow be assuming that corporate profits would be growing on the order of 10% a year also. But how can corporate profits grow 10% a year when the economy is only growing 5% per year?

Suppose corporate profits represented 10% of GDP (about what they do now). And suppose nominal GDP grew 5% a year, and profits grew 10% a year. Then after 10 years, profits would account for 16% of the economy; after 20 years, 25%; after 40 years, 65%; and after 50 years, 100%. Which, needless to say, is patently impossible.


So, what then should we expect?

Well, corporate profits have experienced periods when they grew faster than GDP, but they have also experienced periods when they grew slower than GDP. They have thus regressed to the mean of about 9% of GDP. (Granted, S&P earnings are different than NIPA corporate profits, but for now we'll use them as an imperfect proxy.) (click on any of the charts for a larger image)

So, profits have not consistently grown faster than GDP; they have trended towards the same long-term growth rates.

And how has GDP grown, historically? To smooth out the volatility, I took a four-year average growth rate of nominal GDP. In periods when inflation was high (the early 1980s), nominal GDP was growing at double-digit rates. But over the long-term, nominal GDP growth has averaged under 6%, and, in fact, in the post WWII-era, has never been lower than it is now.

So, why again have stocks returned double-digits?

Well, actually, they haven't. In one rare 18-year bull market, they certainly did. But not over the long haul. Adjusted for inflation, low single-digit growth is much more typical, in fact.

So don't go expecting a return to the good ole days of the 1990s. Every time that's happened before (the 1920s, the 1950s and the 1990s), we've ended up with long bear markets to pay for the excesses of the bull markets.

More on valuations in a later post.

Tuesday, June 22, 2010

Q2 Forecast

US unemployment is high (near 10%) and core inflation is low (near 1%) so Fed needs to remain very accomodative; in fact, a Taylor Rule prescription suggests FOMC s/b at -5% or so right now, so, relative to where they should be, the Fed is as TIGHT as it ever has been in the AG/BB era

---> Fed on hold through 2012, likely longer, as per Japan


BoC caught between rock and hard place: doesn't want frothy domestic housing and household debt markets to turn into dangerous bubbles, so would like to be more restrictive, but knows external demand will highly influence economy, and risks there growing significantly

---> BoC will hike in July and likely again in September, getting to 1%, by which time the U.S. and global economic outlooks will have deteriorated sufficiently to keep BoC on hold indefinitely


U.S. economic outlook is gloomy for a number of reasons (with or without the European problem); paraphrasing from Andy Harless:

1. quantitative easing, which was temporarily buttressing demand, is over (for now) imparting a downward bias to growth in the coming quarters (before QE gets revived again)

2. fiscal stimulus has been largely exhausted (see recent post) so that its impact will be declining in the coming quarters, imparting a downward bias to growth; even if additional stimulus funds are come up with, they are likely to be modest given the political climate and the paranoia about fiscal deficits (legitimate concern for Mediterranean countries in Euro, but for US, like Japan before it, not yet a legitimate concern), such that any future stimulus will be less than past stimulus, so will have declining impact on GDP growth regardless


3. pent-up demand from consumers (many of whom were worried about the losing their jobs last year but no longer are) has been largely exhausted, and its impact will likely decline over time, imparting a downward bias to growth in the coming quarters.

4. inventory adjustment process has run its course (manufacturing inventories are actually quite elevated relative to shipments/sales); significant increases in production are no longer necessary to maintain inventories, so while inventories added significantly to Q4/09 and Q1/10 growth, may detract, and certainly not add, to H2 growth.

5. recent dollar strength and weak external demand (particularly Europe, but anticipate slowing elsewhere as well, including BRICs) mean export growth will not drive robust recovery.

6. normally, the surge in productivity at the beginning of a recovery is followed by a surge in employment, with a lag of about two quarters; there has been no employment increase following last year’s surge in productivity (exempting census jobs, which, added in spring, will be lost by autumn); meanwhile, productivity growth has settled back into the normal range, which dampens hope for a future surge in employment.

7. Bush tax cuts expire at the end of 2010, which will be drag on income growth and thus on economic growth starting six months out

8. a housing double dip is soon arriving, as government stimulus for housing market, which temporarily supported house sales data, has been lost, and banks will need to increase the pace of foreclosure activity, and there is substantial shadow inventory already; and prices, though they have fallen substantially, remain above their long-term norms in terms of price-to-income and price-to-rent ratios, and can be expected to revert below their means given supply overhang, high unemployment, flat income growth, etc. (see T2 Partners' presentation)

9. the next wave of the credit crisis is ramping up right now; the first wave was subprime, whereas this wave is option ARM
10. consumer balance sheets remain extremely stretched; the process of deleveraging has just begun, and will take many many years to be complete

11. state and local government budgets are severely impaired; these governments, some of which are already in crisis mode, will act like 50 little Hoovers going forward; state and local government spending is 50% larger than federal government spending; has acted as drag on growth in recent quarters, at an escalating pace, and given that fiscal year ends are June 30 and new budgets need to be pared back, the pace of contraction will escalate further

x. there is no evidence of any positive stimulus to growth that would offset all these negatives; in fact, the Consumer Metrics and ECRI leading indicators are already flagging potential of double-dip, and those indicators have been steadily deteriorating over recent weeks/months, with no signs of turning around; even the Conference Board's LEI, once you extract stock prices, yield curve and money supply growth, were negative in 2 of last 3 months


xi. as per Hussman, when you have had credit spreads widening over 6 months, in conjuction with stock prices down over 6 months, in conjunction with a moderate or flat yield curve, in conjunction with an ISM of 54 or below and moderate or declining employment growth, a current or imminent recession has been flagged without error in every instance (i.e. each those criteria is not particularly notable by itself, but in conjunction they are very notable); all the conditions are met with the exception of the ISM


---> U.S. double-dip


Canada is the tail that gets wagged by the U.S. dog; as goes their economy, so goes ours, although with more volatility; for more on Canada, see past post.


as per the Edward Chancellor piece (or brief summary here), I believe China is a bubble waiting to pop, a la Japan 1989 or US 1999; its growth has not just been supported by government stimulus, which, arguably, could continue indefinitely, but also by extraordinary and unhealthy credit growth, by a housing bubble, and by over-investing in yet more excess capacity (malinvestment), none of which are sustainable; its just a matter of (indeterminate) time before they pop and cause major headaches


I have long anticipated, and continue to anticipate the Japan scenario, or one much like it, to play out in the U.S.: i.e. once the BoJ was under 1%, it stayed there; and 10-year bond yields have been at or under 2% for over a decade; there has been deflation for 15 years; the Nikkei is at a quarter the level of its peak, and half the level it was at 10 years ago; money multiplier and velocity contraction have more than offset any money supply growth; real estate prices have been trending down persistently since the peak; consumption has been flat for over a decade; nominal GDP is at the same level it was at 18 years ago


even in the absence of a double-dip in the U.S. (which i DO expect), unemployment resolutely above its normal rate (NAIRU) is disinflationary, and we already have core CPI at 1%, which, i believe, posits strongly for deflation; even if one took the Fed's central tendency forecasts of unemployment and inflation for 2010/11/12, as per the SF Fed, the Fed should be on hold into 2012 (taking account of QE) or through 2012 (assuming no QE)
none of this is good for stocks; all is good for bonds (and gold!)

stocks remain overvalued; forward P/E ratios are worse than useless; on a forward P/E basis, stocks are fairly valued, at just under 15 ---- but fwd P/E has been between 14 and 15 non-stop for the last 5 years!!!

forward earnings estimates are pricing in huge advances in E, not at all consistent with a modest GDP growth environment, much less a double-dip or Japan scenario

longer-term measures of valuation more clearly show how overvalued the stock market is; the Q-ratio, relative to its long term average, shows the S&P about 35% overvalues; the cyclically-adjusted P/E ratio (using 10-year average earnings) shows similarly (CAPE is north of 20, relative to long-term average of 16ish)

based on E of 60 and P/E of 15, fair value of S&P is 900ish

given that I predict another downleg for the economy, I anticipate that analysts will again overreact on the downside (as they did when S&P hit 666), and S&P will trade in 800s again in next 9 months

S&P/TSX will trade in kind

GoC 10years will trade south of 3% and long bonds will approach 3% (while US 10s will once again approach 2%)


p.s. bonus forecast item: Netherlands wins World Cup -- go Orange!