Pages

Sunday, February 26, 2023

2023-02-26

 *** denotes well-worth reading in full at source (even if excerpted extensively here)


Economic and Market Fare:

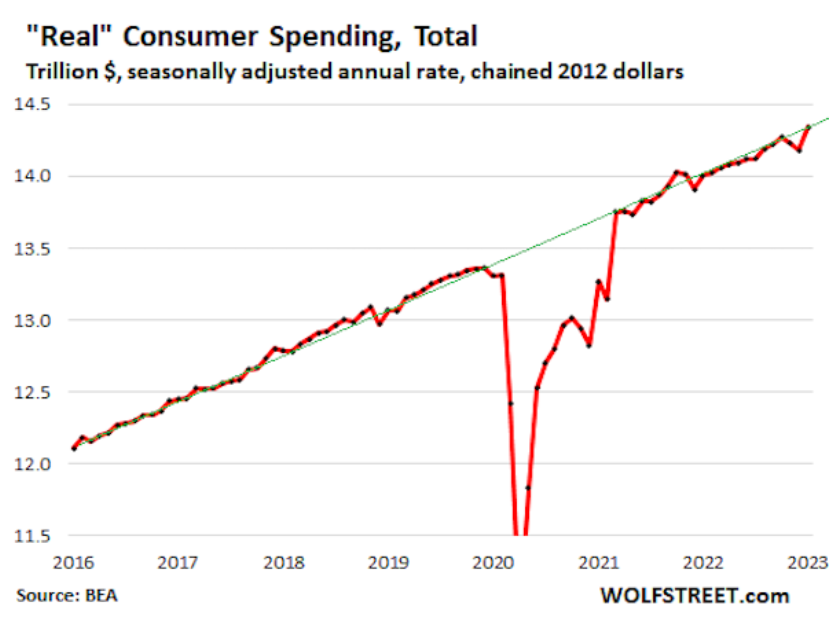
Here's Where The Surge In January Spending And Inflation Came From: Biggest Tax Drop In History

.... So far so good, but what makes historical comps difficult is that in January, there was a comprehensive overhaul of the underlying data. As the BEA notes, "for July through September, estimates for compensation, personal taxes, and contributions for government social insurance reflect the incorporation of updated third-quarter wage and salary data from the Bureau of Labor Statistics Quarterly Census of Employment and Wages program."

Which means that January data was unique in that it was based on revised historical data, while layering on top new numbers for January, which also incorporate several fundamental changes as a result of the new year. .......


.... If you have never heard of hedonic adjustments or the substitution effect, the Boskin Commission, or how what I call ‘phoney baloney’ inflation data was institutionalized, then I encourage you to read/revisit that piece.

These concepts are all once again timely, as the recent uptick in reported inflation data appears to have contributed to interest rate markets repricing significantly. Whereas rates markets had priced in a significant probability of the US Federal Reserve reversing course and cutting rates in the 2nd half of 2023 and into 2024, the confluence of hotter than expected inflation reports along with non-farm payroll and retail sales, has largely wiped out those odds and pushed the likelihood of rate cuts out further into the future. .................

............ On a cyclical basis, the rate of consumer inflation has very likely peaked. In addition, barring scenarios such as a severe currency depreciation/crisis, recessions are typically disinflationary/deflationary…..eventually. Markets, and perhaps the Fed, appear caught up in a renewed mini-bout of inflation anxiety and even a theoretical “soft landing” scenario for the US and Eurozone economies. Such bouts of optimism have been pretty normal immediately preceding and/or well into recessionary periods historically, as took place in early 2001 and well into 2008, for example. While the forecast from Kayfabe Capital Tower remains a severe global recession, becoming obvious even to the Fed sometime in 2023, that will eventually cause ‘inflation’ to fall further.


Stock market bears are fixated on the belief that inflation is not only "running hot" but also "accelerating." Nothing could be further from the truth. 

Some charts that help put things into perspective: .......

Conclusion: the Fed should stand pat and watch how things evolve from here. ......

Chart #5 shows that natural gas prices have truly collapsed, falling by way more than ever before in a short span of time. Traders say it's due to warm weather in the East. Regardless, this is an important source of energy for vast swaths of the economy, and it equates to a powerful deflationary force. And let's not forget that oil prices have plunged 35% from their highs last May. It's not just the weather; commodity prices are down across the board over the past 6-12 months. Monetary policy is undoubtedly one of the reasons.  .........

Chart #8 shows the year over year changes in the Personal Consumption Deflators (with the Core version being the Fed's favorite measure of inflation). Both rates came in a few tenths of a percent higher than the market expected. Does that sound like inflation accelerating? Or running hot? No. Inflation pressures peaked many months ago. Both of these measures are on track to show year over year gains that are much lower than their current level. It takes time for monetary policy–which is undoubtedly tight—to work its way through the economy. We just need to be patient.

Next Tuesday we'll have the all-important release of the January M2 money supply number. I expect it will show a continued decline, which will strongly reinforce the outlook for slowing inflation in the months to come. 


.......... Hartnett's punchline is also his "endgame" trade recommendation - go all in the next big recession, when the Fed goes all-in "Japan", and is forced to launch yield curve control (YCC) the same way it did during World War 2, to keep the dollar reserve status, and the western financial system from disintergrating


Variant Perception: The Capex Supercycle

An old asset base + large infrastructure spending gap + negative real financing costs (financial repression) = an incoming capex supercycle. This is the final part of our 3-part series based on the insights from our “Age of Scarcity” thematic report sent to VP clients in November 2022. See here for Part 1 and Part 2.

The US’s fixed asset base is extremely old. The last time it was this old was just after WWII, which preceded a huge capex reconstruction boom. The American Society of Civil Engineers has graded the US infrastructure as C-. The Global Infrastructure Hub estimates that the infrastructure spending gap is now at 800bn USD per year (right-hand chart). The surge in net-zero commitments will also necessitate plenty of investment and capex.

Is it finally “infrastructure week”? Minsky called it “managerial welfare-state capitalism”: big government + big business + big labor. Financial repression is usually needed to keep debt servicing costs low. There are lots of successful examples: ......

.... Infrastructure is in the sweet spot of being a politically-favored industry and capital scarce, and is set to benefit greatly out of the next recession.

...... Do not forget about the importance of the business cycle. Liquidity leading indicators lead global listed infrastructure returns (top chart). All of VP’s cyclical indicators point risk-off on a 6-month horizon .......


Jim Chanos, the president and founder of Kynikos Associates and well-known investment manager talks to Rob about the post-pandemic financial system, which has become more steeped in a casino culture than it has been in a very long time, and whether China’s financial situation serves as an example or as a warning.


Bubble Fare:


It took ~15 years but over time retail investors have totally forgotten the pain of 2008. After the 1930s, the generations that endured that pain NEVER forgot, even decades later.

Today's financial media is wholly derelict in their duties, as they have been for decades amid an ever-growing debt bubble heading for inevitable disaster. .....

.... So far, global housing prices - with some regional exceptions - are holding up, but sales volumes have collapsed. A precursor to major price decline. 


Archaic perhaps, but I am an impassioned proponent of sound money – and have been for a long time. It’s vital – fundamental. The Austrian School of Economics heavily influences my analytical framework. I focus first on Credit inflation – the expansion of new financial claims. This new purchasing power has varied inflationary effects – including consumer and producer price inflation, asset price inflation and Bubbles, over/mal-investment, trade and current account deficits…

Prolonged periods of excessive Credit growth ensure Bubbles (i.e. Credit, asset, speculative and investment) and progressively destabilizing Monetary Disorder. Inflation is insidious, pernicious and poorly understood. Policy and economic circles will continue to debate “r-star” (the so-called “natural rate” of interest). Others will waste time debating the appropriate inflation target rate. Two or 3% doesn't matter at this point. Decades of damage have been wrought to financial, market and economic structures.

We’re now three decades into history’s greatest Credit Bubble, which, not by accident, coincided with radical monetary management experimentation. I often refer to the “Terminal Phase” of Bubble excess, with systemic risks rising exponentially as the cycle comes to its fateful conclusion. That these dynamics have unfolded on an unprecedented global scale only makes the backdrop more perilous. ..........

Suddenly, it’s as if global markets have awoken to the risk that central bankers might be battling stubborn inflation for several years. What a difference a few weeks make.

I certainly have my doubts that consumer inflation will conveniently return to previous dynamics. New cycle dynamics are at play. Indeed, there is today every reason to expect ongoing deterioration in the geopolitical backdrop. The forces of “de-globalization” and, more specifically, decoupling from Russia and China gain momentum by the week. In the U.S. and elsewhere, there are powerful investment booms associated with domestic manufacturing, renewable energy, infrastructure, defense spending and climate change. And there aren’t enough workers. These are patently not elements of previous cycle dynamics.

.... I expect California to illuminate a fundamental Bubble maxim: inflation may appear the great wealth creator during the boom, but when Bubbles burst the true scope of wealth destruction is revealed. California has plenty of company. Bursting Japanese and Chinese Bubbles, in particular, will expose epic inflated perceived wealth, mal-investment and wealth destruction.

........... I certainly don’t sense that markets are prepared for a return of the 2022 dynamic – only worse. But when deleveraging takes hold, the questions from last year will return: Where is the Fed put? How quickly would the Fed shift to QE – and at what size? And the more persistent inflationary pressures, the more difficult these questions will be for the Fed. At this point, any serious de-risking/deleveraging episode comes with major risks. The day markets begin to question the Fed and global central bank liquidity backstop, there is a serious problem.

A scenario doesn’t seem that far-fetched to me. Confidence in China’s recovery wanes. The new BOJ governor faces a disorderly yen devaluation and fragile bond market. Already destabilized global markets – especially the vulnerable European periphery and EM – get hit by geopolitical developments. Escalation in the Ukraine war – nuclear blackmail. The U.S. responds to Chinese war support with sanctions – China reciprocates. Things become heated. Global markets turn dicey, with pressure on the Fed to intervene with bond market-stabilizing QE. With one eye on shaky markets and the other on sticky inflation, how will the Powell Fed respond? Will it suffice? Years of unsound “money” coming home to roost. ..........


Quotes of the Week:


Charts:
1: 


(not just) for the ESG crowd:

As EV batteries consume more lithium, report warns against increased mining of it


In Indonesia, sickness and pollution plague a sprawling factory complex that supplies the world with crucial battery materials.

.... A decade ago, Labota was a fishing village; today it’s been subsumed into a sprawling city centered around IMIP, a $15 billion, 3,000-hectare industrial complex containing steelworks, coal power plants, and manganese processors, with its own airport and seaport. Built as a joint venture between Chinese and Indonesian industrial companies, it is at the heart of Indonesia’s push to supply the electric vehicle market with nickel, a core component of batteries.

Rocketing demand for electric vehicles, combined with supply disruptions caused by Russia’s invasion of Ukraine, have made Indonesia—and IMIP—a critical link in the supply chains of EV manufacturers. That's especially true for Tesla, which has signed multibillion-dollar deals with companies at the site and is reportedly in talks to set up its own manufacturing facility in the Southeast Asian country. 

Meeting this demand has come at a huge social and environmental cost. ........


In this issue: ▸ ESG ratings both wrong and scary ▸ Executives get “green” bonuses despite slow progress ▸ The US will make “no apologies” for green jobs ▸ And much more...

...... There is something scary, very scary about this. ESG is becoming a tool that upholds the system of the 10%. It is not and never was the intention of ESG. The current ESG ratings provided to the financial markets are simply not only wrong, they are also not really helping us to develop the markets and companies where ESG measures would most likely make the biggest difference.


Other Fare:

On Perry Mehrling’s “Money and Empire: Charles P. Kindleberger and the Dollar System”


Pics of the Week:


Thursday, February 23, 2023

2023-02-23

 *** denotes well-worth reading in full at source (even if excerpted extensively here)


Economic and Market Fare:

Kelton: Biden Wants to Bring Down the Deficit. Powell Wants to Bring Down Inflation. Are Rate Hikes Undermining Both Goals?

................. What Mosler has been saying is that by pushing interest rates sharply higher, the Fed is keeping fiscal policy more expansionary than it would otherwise be. As a result, the government is putting a ton of extra cash into the hands of bondholders who may turn around and spend some of that windfall. And that additional spending can potentially sustain inflationary headwinds.

Obviously, rate hikes can also reduce borrowing and spending, especially on interest-sensitive items like housing and autos, and that can help tame inflationary pressures. Once you bring in expectations, exchange rate dynamics, private sector debt, etc…Well, as I’ve written many times before, there are even more cross currents to complicate the transmission mechanism.

The FOMC doesn’t have an interest rate dial that it can turn up by X percentage points in order to deliver a predetermined change in inflation. Movements in interest rates can ripple through the system in both semi-predictable and surprising ways.3

Mosler acknowledges that rate hikes create both winners (who have more to spend) and losers (who curtail spending). What matters is the balance of these opposing forces. And right now, he thinks the rate hikes are doing more to support aggregate demand than most people—especially central banks—realize. 

....... We’ll look at some of the data in a moment. For now, let me just say that, while not discounting Mosler’s argument, I and other MMT economists have been more worried about the risk of recession as opposed to the risk of stickier inflation stemming from the Fed’s aggressive rate hikes. ...........


If you’re just tuning in, I’ve spent the last few months debunking some common misconceptions about inflation:
  • Is inflation a uniform increase in prices?
    • No. Inflation is wildly differential.
  • Is inflation driven by an ‘over-heated’ economy?
    • No. Inflation tends to come with economic stagnation.
  • Do higher interest rates reduce inflation?
    • No. Higher interest rates are associated with higher inflation.
As expected, the last claim put mainstream economists into war mode. You see, the belief that interest rates down-regulate inflation has come to be sacred. So by scrutinizing this idea with evidence, I was effectively torching an effigy of the pope. (Novelist Cory Doctorow helped fan the flames by writing an incendiary essay about my research.) And so I spent a ‘fun’ week on Twitter being bombarded by econo-scorn.

Now back to science. When I published ‘A Test of Monetary Faith’, I had more evidence in the pipelines — evidence that debunks the idea that interest rates down-regulate inflation. In this post, I’ll wade through the data.

The take-home message is clear: when we look at the World Bank database, there is no evidence that higher interest rates down-regulate inflation. If anything, the evidence suggests that rate hikes make inflation worse.

But before we get to the data, I’ll respond to some of the more cogent criticisms that economist hurled my way. .....


Tymoigne: The Volcker Myths

....... This explains why FOMC members agreed to move to a Monetarist-light framework while at the same time being skeptical of it. The committee sought protection behind the money supply targets that seemed to suggest that the Fed was not responsible for the dynamics of interest rates. Finally, as FOMC members expected, the hikes did produce lots of pain, but inflation went down for reasons largely unrelated to the Fed’s policy; all the pain was for nothing. ...........


We experience seasonal adjustments to an extent NEVER seen in time series history for CPI, Retail Sales and ISM numbers in January. Are we amidst a spreadsheet rebound or an actual economic rebound?

....... Allow me to bump up the nerd’o’meter for a second as I intend on ranting about seasonal adjustments and why economic data is currently extremely noisy consequently. This is of relevance to everyone with a macro-driven investment approach since we have seen some of the most bizarre seasonal adjustments in time-series history over the past couple of months.

So, can we even trust that we have seen a pick-up in activity or is this just a paper-rebound manufactured in the spreadsheets of the BLS and the Census bureau?

Let’s start with the part of the ULTRA-strong January data with the easiest seasonal adjustment to comprehend.

It is fairly straight forward to calculate the ISM Services number in seasonal- and non-seasonal adjusted terms. You take the actual survey responses and divide the diffusion index by its seasonal factor.

As the seasonal factor was RECORD low for both the “business activity” and “new orders” index (0.887 and 0.90 respectively) around 50% of the bounce in ISM Services in January can be explained solely by extraordinary seasonal adjustments.


Recessions have gone out of fashion, with fears one will hit in the next year down sharply, according to BofA’s Global Fund Manager Survey. But the sugar high of some recent, rosy economic prints is not yet enough to derail the weight of evidence pointing the other way.

It’s true the nature and timing of the next recession may be different this time due to the extraordinary circumstances of the pandemic. The change in sequencing already looks unusual: normally inflation only starts falling once the recession has begun, and real wages do not get a boost until almost a year after the recession’s onset.

Recessions are caused when a number of different cycles – the income cycle, the inventory cycle, the credit cycle, the employment cycle – begin to worsen at the same time, and reinforce one other. .........

........ Employment data is among the most lagging and heavily revised. It is one of the reasons recessions appear to happen so fast as it becomes clear the economy was already faring worse than thought.

But the Fed will focus on the data as it is. When you combine this with the current disinflationary trend in the US likely on the cusp of ending due to a China-driven global cyclical upturn, the central bank is poised to keep policy tighter for longer.

The downturn is thus liable to be worse, leaving the Fed needing to cut rates more. The maximum inversion in the yield curve this cycle would be historically consistent with over 500 bps of rate cuts.

This is not a prediction, but it suggests that the Fed will cut more than is currently priced.


Bull steepenings in the yield curve are generally seen as a precursor to a recession, but they are often preceded by bear steepenings. The 3m30y curve is currently bear steepening, indicating a recession could begin as early as the summer.

I discussed the 3m30y’s nascent steepening on Tuesday. Yield-curve inversions indicate a recession is on the way at some point, but it is the subsequent re-steepening that puts the downturn under starter’s orders.

Not all yield curves are alike, and typically it is the 3m30y curve that starts to steepen first, about five months before the recession’s onset. That curve has been steepening since mid-January ......

It is true that bull steepenings are often more violent when the Fed does a volte-face as the economy deteriorates quickly, but bear steepenings are as much a part of the pre-recession picture, and have often preceded the bull steepening in the lead up to a slump. ....

As we can see, all the recessions (apart from 1980’s) were preceded by a significant bout of bear steepening in 3m30y about 3-9 months before the recession started. Bull steepenings tend to come later. .....


In my last post “The Paradox”, I laid out how the January inflation print would likely be “hot”, and how that would likely trigger a sell-off in bonds that takes equities with them. So far, data and markets have indeed followed the sequence

More so, together with seemingly strong January retail sales and unemployment data, many investors are now convinced that a re-acceleration of the US economy is imminent. Even the Fed has joined, as various officials push for even more rate hikes to fight off this presumed resurgence. Meanwhile, it remains very much unclear whether the unprecedented 4.5% interest rate increase over the past year has yet been digested

Has the economy truly turned? Or have we once again fallen victim to our emotions, where prices action tricks the collective mind to cherry-pick arguments that best explain whatever prices suggest?

Today’s post checks in on the most recent data and lays out how the re-acceleration hopes based on January’s consumer-centric coincident data are likely a mirage. Meanwhile, both lead- and increasingly coincident indicators for the cyclical economy continue to deteriorate at a pace rarely seen in the past 70 years. A significant decline in industrial production is likely already under way, historically enough to cause substantial recessions and unemployment ......

Is it true, no recession, are we out of the woods? Or what was actually going on in January? Let’s have a look

Much of the re-acceleration views rest on very strong January retail sales, which came in at +3.0% month-on-month, much better than expected

How did Americans have that much more money in January? Sure, many wages reset that month, as did social security payments for millions of pensioners

But still, such a resurgence seems extreme. In fact, a much more likely explanation can be found in the seasonal adjustments, which overstate the strength of the data.  ......

Now, ok, the US consumer may not be booming, but whatever the data, it also isn’t falling off a cliff

But here’s what’s important - recessions are usually not triggered by consumers. They are triggered by cyclical industries

Regular readers will be familiar with my framework that puts highly volatile housing and durable goods sectors at the center of the ebb and flow of the economy

The huge demand swings in these industries then permeate the remainder of the economy with a lag

I would also like to recall that historically slowdowns in manufacturing were enough to both cause recessions and significant employment losses, even at times when the services sector grew (e.g. ‘69,’73,’01)

So the most critical question we should attempt to answer is - how are cyclicals doing? The answer: Their outlook continues to worsen, as they face a trifecta of headwinds ........


Don’t be fooled. Two important pieces of data came out this week that should be paid close attention to.

On February 16th, the Philadelphia Fed Manufacturing Survey for February was released.  According to MarketWatch, the median estimate called for a decline of -7.8.  The actual result was a decline -24.3. ...

A few interesting observations from this chart and the most recent reading in particular.
  • In six of the eight recessions since the 1960’s, when the index fell to -24.3, or lower, the US economy was already in a recession.
  • In the two instances where this was not the case, September ’79 & January ’01, the US economy entered a recession 4-months and 2-months later, respectively. 
..... 

..... Further, there has been a shift of late in the narrative as it pertains to the US economy and where we might be heading as we’ve gone from a “hard landing” (i.e., a difficult, prolonged recession), to a “soft landing” (i.e., we have a recession, but it won’t be that bad), and now a “no landing” (i.e., we avoid a recession altogether).

Don’t be fooled. This is classic “Return to Normal” behavior! .....


Quietly and off most people’s radar screens, US residential fixed investment (home building) has slumped by 20 percent in the past year – a rate of decline that puts it on a par with the major housing recessions of 1990, 1980, 1973, 1965, and 1951.

Housing recessions matter because they are the ‘canary in the coal mine’ for economy-wide recessions. Not all economic recessions follow housing recessions1, but most housing recessions presage economic recessions.

Housing recessions are the canary in the coal mine for interest rate induced economic recessions. This is because, just as the canary is hyper-sensitive to toxic gases, housing investment is hyper-sensitive to interest rates.

Higher interest rates transfer more income from borrowers to lenders, making it more costly to service existing debt and take on new debt. This suffocates the most indebted parts of the economy – homeowners, homebuilders, and housing investment – before it suffocates the broader economy. So, just as the canary keels over before the coal miner, housing investment keels over before the broader economy.

If we define a housing recession as a 1 percentage point decline in housing investment as a share of the economy, there have been nine US housing recessions since 1948 prior to the current episode. In seven cases, reaching the threshold of a housing recession was the canary in the coal mine for an NBER-defined US recession. The two exceptions being the housing recessions of 1951 and 1965. Since 1970 though, the track record has been perfect.

... In the current downcycle, it’s worth remembering that the first US rate hike happened barely 11 months ago. While this has been more than enough time to suffocate hyper rate-sensitive housing investment, it has not been enough time to suffocate the broader economy. But if the perfect post-1970 track record continues, the current US housing recession is the canary in the coal mine for an economic recession that starts at some point in 2023.


*** The Observatory - Liquidity: Better, But Not Good
lots of charts - worth revisting / reconstructing


Pilkington: Assessing the Economic Value of Military Materiel

The war in Ukraine has exposed some serious misperceptions about the relative economic size and military power of major nations. Before the war, it was fashionable to say—usually sardonically—that Russia possessed an economy similar in size to that of Italy or smaller than that of Texas. “The Russian economy will be cut in half,” President Biden tweeted on March 26, 2022, “It was ranked the 11th biggest economy in the world before this invasion—and soon, it will not even rank among the top 20.”1

The statistics that the president used for this comparison were nominal GDP numbers measured in U.S. dollars. It is unclear why the president’s economic advisers did not direct him to the purchasing-power-parity-adjusted (PPP) GDP metrics, which are the standard tool economists use to compare the relative size of national economies. That statistic would have showed that Russia’s economy is the sixth largest in the world—almost as large as Germany’s and well over twice as large as the economy of Texas. Perhaps PPP-adjusted metrics have become embarrassing in D.C. of late as they show that the Chinese economy is roughly 20 percent larger than the American economy.

Yet this is only the first layer of a rather unsettling onion. In a previous essay, I pointed out that even PPP-adjusted GDP measures may be misleading when it comes to determining the relative importance of various economies.2 This argument is simple enough: not all GDP is created equal. A dollar of GDP generated by a casino is fundamentally different from a dollar of GDP generated by extracting oil. Since econo­mies like China and Russia have far larger mining and manufacturing industries, their relative economic importance is far greater than even a PPP-adjusted GDP figure shows. This goes a long way toward explaining why the Western sanctions did not cut the Russian economy in half, as President Biden promised, but instead created a severe energy crisis in Europe—and the continent now faces the horrifying prospect of dein­dustrialization. ........


Bubble Fare:


Jon Krakauer’s Into Thin Air chronicles one of the deadliest years on Mount Everest, when 12 mountaineers died trying to scale the highest peak on earth. The story reveals both the best and the worst traits of people as many of the climbers try to reach the summit without proper regard for the risks. While scaling Everest has some highly technical aspects, the most dangerous feature is its sheer size. The peak is 3,000 feet above the start of the “death zone” – the altitude at which oxygen pressure is insufficient to sustain human life for an extended period. Many fatalities in high-altitude mountaineering have been caused by the death zone, either directly through loss of vital functions, or indirectly by wrong decisions made under stress or physical weakening that lead to accidents.

This is a perfect analogy for where equity investors find themselves today, and quite frankly, where they’ve been many times over the past decade. More specifically, either by choice or out of necessity investors have followed stock prices to dizzying heights once again as liquidity (bottled oxygen) allows them to climb into a region where they know they shouldn’t go and cannot live very long. They climb in pursuit of the ultimate topping out of greed, assuming they will be able to descend without catastrophic consequences. But the oxygen eventually runs out and those who ignore the risks get hurt…

… Bottom line: the bear market rally that began in October from reasonable prices and low expectations has morphed into a speculative frenzy based on a Fed pause/pivot that isn’t coming. And, while the economic situation appears to have improved at the margin, this will not forestall the earnings recession that has a long way to go, based on our negative operating leverage scenario that is well under way. As the Fed is tightening, financial conditions are continuing to loosen thanks to the liquidity provided by other central banks (mainly the PBOC and BoJ), China’s reopening and a weaker US dollar. Since October, global M2 has increased by a staggering $6 trillion, providing the supplemental oxygen investors need to survive in the death zone. While this oxygen supply can last a bit longer and help the climbers go farther than they should, it can also trick them into thinking they are safer than they really are, which leads to them getting hurt.


***** Hussman: Headed For The Tail

The extreme “tail” risk ahead may be disorienting.

We can allow for deranged monetary policy and enormous fiscal interventions. We can allow for “bit in the teeth” speculation amid historically extreme valuations. We can maintain strategic flexibility, even amid rich valuations, by responding to changes in the uniformity or divergence of market internals. No forecasts are required. Still, I remain convinced that if investors should allow for anything, it is to allow for steep losses in the S&P 500 over the completion of this cycle.

At present, we estimate that a market loss of about -30% would be required to restore expected 10-year S&P 500 total returns to the same level as 10-year Treasury bond yields; about -55% to bring the expected total return of the S&P 500 to a historically run-of-the-mill 5% premium over-and-above Treasury yields; about -60% to bring the estimated 10-year total return of the S&P 500 to a historically run-of-the-mill level of 10% annually. .......

I intentionally use the phrase “run-of-the-mill” to describe potential market losses of -30%, -55%, and -60%, because none of these estimates can be considered “worst case scenarios.” Historically, market cycles typically trough at the point where prospective S&P 500 total returns are restored to the greater of a 10% nominal return or 2% above Treasury bonds, so I lean toward expecting the -60% outcome. Nothing in our discipline relies on that outcome. Still, I believe it is not only possible but likely.

You may be quietly thinking that this entire introduction is preposterous, and that the estimates of potential drawdown are implausible. The chart below shows how reliable valuation measures have been related to actual subsequent market losses over the completion of market cycles across history. It’s important to notice that the blue “cups” are not always filled with red ink immediately. Speculative market cycles often involve extended segments when valuations are extreme, and then become more extreme without apparent consequence. Those segments of the market cycle are what market internals are for – we’ll talk about that shortly. Still, the deferral of consequences is very different from the absence of consequences. My concern is for investors that may discover that the hard way. 


No forecasts are required
In the discussion that follows, we’ll examine valuations, profit margins, interest rates, monetary policy, growth, and the composition of the S&P 500. That’s important, because all of these have been used as ways to “justify” today’s elevated valuations, and all of them are problematic. We’ll begin with updated charts and a discussion of our key measures of valuations and market internals. Following that, the progression of charts may feel increasingly brutal, because they deconstruct justifications that Wall Street repeats to investors, and that you may even repeat to yourself. I’ll limit any math to “Geek’s notes” that you can skip if you prefer.

It’s essential to emphasize, right at the outset, that nothing in our discipline relies on valuations to retreat anywhere near their historical norms. I clearly expect that they will, but we emphatically don’t rely on that. Our discipline is to align our investment outlook with measurable, observable market conditions, particularly valuations and market internals. With one important exception, that’s the same discipline that allowed us to navigate decades of previous market cycles, including the tech and mortgage bubbles and their subsequent collapses (not everyone recalls that I was a leveraged, “lonely raging bull” in the early 1990’s).

The single most important change to our discipline in recent years, as I’ve regularly discussed, is that a decade of zero interest rate policy forced us to abandon our reliance on certain “limits” to speculation, which had been reliable in every previous market cycle. My incorrect belief that speculation had a “limit” became detrimental amid the Federal Reserve’s unbridled expansion of zero-interest liquidity. Valuations and internals remain essential elements of our discipline, but we can no longer be pushed against the wall of “limits.” Reckless or not, the Fed can do what it likes. We’ll be just fine.

Valuations inform our expectations for long-term market returns and our estimates of market losses over the completion a given market cycle. But if rich valuations were enough to drive the market lower, we could never have reached the extremes observed in 1929, 2000, or early-2022. Market outcomes over shorter segments of the market cycle are driven by investor psychology. Today’s extreme valuations reflect a decade of yield-seeking speculation that drove valuations beyond every lesser extreme. Rich valuations aren’t enough to drive the market lower. The trap door opens when rich valuations are joined by risk-aversion. We find that speculative and risk-averse psychology is best gauged by the uniformity or divergence of market internals over thousands of individual stocks, industries, sectors, and security types, including debt securities of varying creditworthiness. When investors are inclined to speculate, they tend to be indiscriminate about it. In contrast, deterioration and divergence of market internals is the hallmark of emerging risk-aversion. .................................


The end of cycle fool's rally is ending, as it appears the last fool was finally found. Since the start of the year bullish pundits have been rounding up useful idiots to feed into the Dow Jones hopper, however the almighty Dow Jones Illusional Average has now given up six weeks of gains in three days. Amid record retail investor inflows...

Over the course of the past year, the bullish thesis has shape shifted from hyperinflation to inflation, stagflation, soft landing, and now no landing, meaning no inflation AND no recession, the delusion du jour. You have to be brain dead to believe it, hence it's now Wall Street consensus:

The "No landing" fantasy was fabricated in order to allay investor concerns that an ever-more hawkish Fed will implode the economy, as they have every other time in history. So, the *new* fairy tale is that Fed over-tightening can bring down inflation while the economy continues to grow robustly. It's abundantly clear by this level of end of cycle denial that the latest uptick in social mood has completely fried the brains of today's financial punditry.  ....

... Ironically, this same sequence of events played out in 2008: An end of cycle rally attended by an uptick in consumer sentiment, and a Fed totally concerned with inflation. A massive policy error, and then an unforeseen collapse. .....


Vid of the Week:

worth linking to even if only for his take on the benefits of the stagflationary 1970s:


Charts:
0: Bilello: The Week in Charts
2: 
3: 
4: 
5: 
6: 
7: 
8: .
9: 
10: 


...
...


(not just) for the ESG crowd:

A leaked video of ocean pollution during a trial by The Metals Company (TMC) has renewed calls for a ban on deep-sea mining


Corporate Climate Responsibility Monitor 2023
The Corporate Climate Responsibility Monitor evaluates the transparency and integrity of companies’ climate pledges.

Companies around the world are increasingly alert to the climate emergency. They face calls from a growing range of stakeholders to take responsibility for the impact of their activities. Most large companies now have public climate strategies and targets, many of which include pledges that appear to significantly reduce, or even eliminate, their contributions to global warming. The rapid acceleration of corporate climate pledges, combined with the fragmentation of approaches, means that it is more difficult than ever to distinguish between real climate leadership and unsubstantiated greenwashing. This is compounded by a general lack of regulatory oversight at international, national and sectoral levels. Identifying and promoting real climate leadership, and sorting it from greenwashing, is a key challenge that, where addressed, has the potential to unlock greater global climate change mitigation ambition.The 2023 Corporate Climate Responsibility Monitor assesses the climate strategies of 24 major global companies, critically analysing the extent to which they demonstrate corporate climate leadership (Section A, summarised in Table S.1). We evaluate the integrity of climate pledges against good practice criteria to identify examples for replication, and highlight areas where improvement is needed (Section B, summarised in Table S.2). This is the second iteration of the Corporate Climate Responsibility Monitor, whereby the 2022 analysis revealed a number of issues with corporate climate strategies.


The stealth export of waste plastic clothing to Kenya


Sci Fare:


.....That process, the idea that knowledge was something not handed down by gods or elders, but evolving, something to be quickly interrogated and built upon, set in motion, Rovelli argues, what we understand as the scientific method. If Newton characterised himself as “standing on the shoulders of giants”, then the two men near the very base of that human pyramid were Anaximander and Thales of Miletus. In evolving the thinking of Thales, we’re told, Anaximander was not only the first human to argue that rain was caused by the observable movements of air and the heat of the sun rather than the intervention of gods – the kind of “natural wisdom” that was heretical enough to lead to the trial and death of Socrates 200 years later – he was, crucially, also the first thinker to make the case that the Earth was a body suspended in a void of space, within which the sun and stars did not form a canopy or ceiling but revolved. This literal groundbreaking idea – inventing at a stroke the idea of the cosmos – was, as the historian of science Karl Popper suggested, “one of the boldest, most revolutionary and most portentous ideas in the whole history of human thinking”.


How Emily Dickinson, scientists, and other writers theorized plant intelligence in the nineteenth century


Other Fare:


Saturday, February 18, 2023

2023-02-18

 *** denotes well-worth reading in full at source (even if excerpted extensively here)


Economic and Market Fare:


There has been a burst of optimism about the state of the world economy since the beginning of the year.  At the end of last year, the consensus of many economic forecasts was that the major economies were heading into a slump in 2023.  Most of the international agencies were forecasting a slowdown in economic growth at best and at worst a contraction in national outputs of the major economies.  I too posted a forecast for 2023 as “the impending slump”. But now the mood has changed. ....


....... And let’s weigh in with the factors that suggest the US is heading for recession this year.  First, a sizeable section of the economy is already contracting. .......


Bank of Canada Governor Tiff Macklem, speaking for the first time since the report on January's job blowout came out last week, said on Thursday that the economy remains overheated and continued to leave the door open to higher interest rates. ....


Is inflation "running hot" because the January stats on the CPI and PPI were stronger than expected? No. Ups and downs in the monthly data are to be expected, so this is not necessarily something to worry about, especially since the macro picture hasn't changed for the worse at all.

Keep focused on the all-important monetary and macro variables: M2 and interest rates. The M2 measure of money supply is declining, and higher interest rates are increasing the demand for money; this is a one-two punch (an increased demand for a smaller supply of money) which is rapidly snuffing out inflation. Higher rates are having a big impact on the housing market, and the bond market continues to price in low inflation and a positive economic outlook. The dollar remains strong, gold is weaker on the margin, and commodity prices are soft. The result of all of this is that inflation pressures are declining on the margin. ....

............. Chart #9 compares the year over year growth rate of M2 (blue line) with the year over year growth in the consumer price index (red line), the latter being shifted one year to the left in order to show that it takes a year or so for changes in M2 to show up in changes in inflation. The decline in M2 this past year strongly suggests that CPI inflation will continue to fall over the course of this year. Steve Hanke and John Greenwood recently wrote about this in the WSJ, and they echo many of the things I have been saying in this blog. We have been on the same M2 page for a long time. (But I'm not quite as concerned about recession as they are.) ........


Global liquidity conditions remain the tightest they have been for several decades, continuing to pose a formidable headwind for risk assets.

Liquidity is probably the most important short- and medium-term driver of risk assets. The fundamental value of an asset becomes moot as in extremis, with no liquidity, there can be no transactions. This means catching turns in liquidity is of paramount importance.

After falling for over a year, a turn higher in liquidity may already have arrived according to some - but I’ll show why it is too early to sound the all clear.

First we have to be clear what we mean by liquidity. It can be measured in many ways, but from a trading and investment standpoint all that should matter are those indicators that can give us a lead on asset prices.


“real GDP growth comes to a halt in 2023 in response to the sharp rise in interest rates during 2022.”


Horizon Kinetics: 4th Quarter Commentary.

Prefatory Remarks
There is more clarity gained from thinking about investing than talking about investments, and in discussing context before talking corporate earnings. Part of today’s economic context is that investors now face questions they haven’t had to consider for 40 years, such as how to protect purchasing power in a chronic inflationary environment. Part of the investment context is the dawning realization that the indexation and asset allocation models that came to dominate the past 20 years can no longer be relied upon as having predictive value. 

One reason those models are now in disarray is because they depended on a presumption that the prior 20 or 40 years of daily price data represented normality, whereas it actually described an anomalous period that won’t be reproduced ‘in the next cycle.’ .......

.......... The magnitude of today’s debt levels must greatly reduce the central bank monetary policy options. This is the central difference between the prior inflationary period and the current one. If the inflation cannot be controlled by interest rate increases, perhaps it cannot be controlled. 
  • One policy solution is to control inflation via money supply, meaning actually reducing the money supply. The last time that was tried was during the Great Depression. It did not work out as well as the theoreticians might have hoped. That idea has since become anathema to the point of taboo. 
  • The usual choice in such circumstances is to do the opposite of the Great Depression approach, namely to tolerate or even encourage inflation, using time as tool. Over time monetary inflation diminishes the relative value of the debt liabilities (more dollar bills in the economy per unit of bonds). That is the mechanism at the government’s disposal. The central bank might already be trapped into a long-term strategy of inflationary money printing.
.......


.................... While the market is defiant that the Federal Reserve will engineer a “soft landing,” The Federal Reserve has never entered into a rate hiking campaign with a ”positive outcome.” Instead, every previous adventure to control economic outcomes by the Federal Reserve has resulted in a recession, bear market, or some “event” that required a reversal of monetary policy. Or, rather, a “hard landing.”

Given the steepness of the current campaign, it is unlikely that the economy will remain unscathed as savings rates drop markedly. More importantly, the rate increase directly impacts households dependent on credit card debt to make ends meet.

While investors may not think a hard landing is coming, the risk to consumption due to indebtedness and surging rates suggest differently. .......


Rickards: China’s Ensnared in the Middle-Income Trap


Proof of reserves is all the rage on crypto platforms. The idea is that if the platform can prove to its customers' satisfaction that their deposits are fully matched by equivalent assets on the platform, their deposits are safe. And if the mechanism they use to prove this uses crypto technology, that's even better.  Crypto tech solutions have surely got to be much more reliable than traditional financial accounts and audits - after all, FTX passed a U.S. GAAP audit. 

No, they aren't. Proof of reserves as done by exchanges like Binance does not prove that customer deposits are safe. It is smoke and mirrors to fool prospective punters into relinquishing their money, just like claims that exchanges and platforms are "audited" or have "insurance". There are no audits in the crypto world, there is no insurance, and as I shall explain, proof of reserves proves absolutely nothing. ....


Quotes of the Week:

BAML: We continue to like down in credit high yield floaters in sectors such as leveraged loans, which yield 9%, paired with high quality long duration bonds such as 30y UST, which yield 3.8%…: yield declines in long duration treasuries (or investment grade corporates or municipal bonds) should at least partially offset spread widening. Among quality bonds, 30y UST would be expected to deliver the highest total returns in the more adverse economic scenarios … The 20% allocation to 30y UST has been seen to reduce drawdowns in the context of loan weakness in late 2018 and early 2020. We view any near-term backup in interest rates as a good opportunity to add high quality duration exposure.


Kayfabe: Along with ECRI’s framework, the other three pillars of Kayfabe Capital are now screaming extreme cycle-timeframe caution. I am being explicit in ringing the alarm bells, after a year+ of laying out potential risks and pathways to this point.


Snider: Tester/Bullard talking about 50 bps. Economically illiterate, they're just making it up as they go, so until crashing deflation shows up in convincing fashion policymakers will keep plugging more rate hikes for fear it mysteriously reignites if only just to spite them.

Snider2What does the Fed really need to see from the CPI/PPI, let alone the actual economy. Prices have clearly slowed even when factoring Jan’s bounce. Do they need to outright crash before the FOMC is satisfied? Yes, because the FOMC doesn't know where inflation comes from.


Charts:
1: 
2: 
3: 
4: 
5: 
6: .
7:
8: 
9: 


...


Podcast of the Week:


if you prefer, transcript available here


(not just) for the ESG crowd:

The logic of privatization in climate finance

In the eyes of the IMF, a G20 panel, and, lately, the US Treasury Secretary, the time has come for multilateral development banks to adapt their development mandates to the logic of derisking. This tactic—lauded as a solution for “mobilizing” the trillions necessary to achieve the green transition—demands that public entities shift private investors’ risks onto their own balance sheets, incentivizing investment to meet the world’s infrastructure needs.

Although development banks have floated serious plans to reorient themselves toward catalyzing private investment since the “billions to trillions” hype in 2016, such efforts never took off. The World Bank’s recently leaked “Evolution Roadmap” is its latest attempt to kickstart derisking at a global scale.

But the roadmap’s emphasis on mobilizing private finance through derisking obscures one proposal that on the surface appears to run the other direction. Securitization allows public entities and development banks to offload their assets to the private sector, thereby transferring risk away from themselves and freeing up their balance sheets for more immediate lending. To be sure, securitization still fits snugly within economist Daniela Gabor’s Wall Street Consensus, in which governments meet development goals by turning public services into investment opportunities for private finance. But while derisking calls for the public sector to shoulder additional risks, securitization calls for shrugging them off.

How would securitizing the World Bank’s portfolio work, and how does this tactic relate to  the larger derisking turn in development finance? Is securitization a preferred alternative to derisking, or does it align with its broader logic? .......


Barclays on Wednesday said it would no longer provide financing to oil sands companies or oil sands projects and tightened conditions for thermal coal lending in an updated policy, which fell short of announcing overall pledges or targets in funding oil and gas. .......


Other Fare:


Canadian universities are reporting a rise in academic misconduct cases in recent years, a trend that was exacerbated by the pandemic