If, like most investors around today, you started paying attention to the stock market in the 1990s, you might be excused for thinking so.
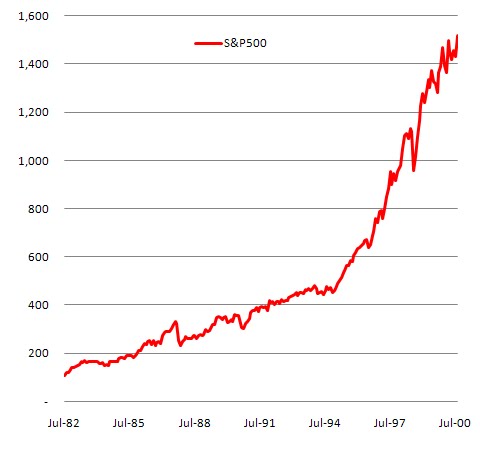
The 18-year equity bull market that started in 1982 and ended in 2000 saw the S&P 500 go parabolic, from about 100 to over 1500, for a cumulative gain in 18 years of a whopping 1317%, or an annualized return of 15.8%.
 Though there were some dips along the way, most notably in October 1987, the market typically rallied back strongly, so though there was quite a bit of volatility in one-year price returns (based on monthly data, excluding dividends), from a low of -21% to a high of +52%, longer-term returns were always positive, and typically generously so, with five-year returns only falling as low as 5%, but going as high as 26%, and nearly always in double-digit territory.
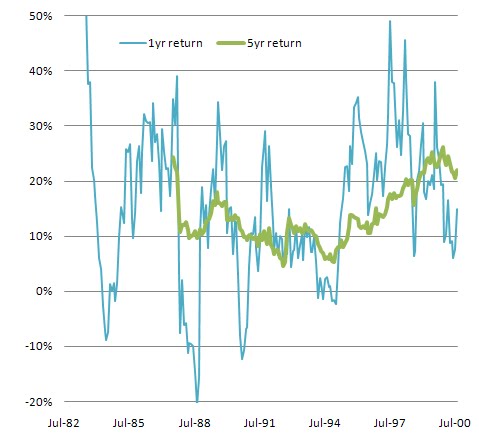 But does that recent stock price history really tell us much about how stocks should perform? After all, why rely on the memory of the 1990s when in the 2000s we have experienced something entirely different, i.e. two wicked bear markets. From the March 2000 peak of 1550, the market got cut in half to the October 2002 low of 768. It then surged back to a new high in October 2007 of 1576, before again being cut by more than half to a low of 666 in March 2009.
 One-year returns have therefore ranged from as low as -45% to as high as 50%, and five-year returns from -8% to +13%, but on the whole over that period, the market is down 29%, for an annualized return of -3%.
 Clearly, we're not getting the 10%+ returns we became accustomed to!
But, frankly, why should we expect 10% anyways?!
Think of it this way: stock prices should go up commensurate with corporate earnings; and corporate earnings should go up commensurate with the economy. If the economy grew at 5% per year on average, if we were to expect stock prices to go up 10% a year, we must somehow be assuming that corporate profits would be growing on the order of 10% a year also. But how can corporate profits grow 10% a year when the economy is only growing 5% per year?
Suppose corporate profits represented 10% of GDP (about what they do now). And suppose nominal GDP grew 5% a year, and profits grew 10% a year. Then after 10 years, profits would account for 16% of the economy; after 20 years, 25%; after 40 years, 65%; and after 50 years, 100%. Which, needless to say, is patently impossible.

 So, what then should we expect?
Well, corporate profits have experienced periods when they grew faster than GDP, but they have also experienced periods when they grew slower than GDP. They have thus regressed to the mean of about 9% of GDP. (Granted, S&P earnings are different than NIPA corporate profits, but for now we'll use them as an imperfect proxy.) (click on any of the charts for a larger image)
 So, profits have not consistently grown faster than GDP; they have trended towards the same long-term growth rates.
And how has GDP grown, historically? To smooth out the volatility, I took a four-year average growth rate of nominal GDP. In periods when inflation was high (the early 1980s), nominal GDP was growing at double-digit rates. But over the long-term, nominal GDP growth has averaged under 6%, and, in fact, in the post WWII-era, has never been lower than it is now.
 So, why again have stocks returned double-digits?
Well, actually, they haven't. In one rare 18-year bull market, they certainly did. But not over the long haul. Adjusted for inflation, low single-digit growth is much more typical, in fact.

So don't go expecting a return to the good ole days of the 1990s. Every time that's happened before (the 1920s, the 1950s and the 1990s), we've ended up with long bear markets to pay for the excesses of the bull markets.
More on valuations in a later post.
No comments:
Post a Comment