Pages

Friday, August 6, 2010

August 6

Will quantitative easing spur inflation? job creation? credit expansion? do anything? Mish.


data today:

good news:
ECRI WLI rose for the first time since April, to -10.3 from -10.7, though still below the critical recessionary level of -10 (okay, so just very modestly good news)


chart from zero hedge


bad news #1:

though ECRI improved, Consumer Metrics Institute's Growth Index continues to decline


chart from Doug Short

bad news #2:

non-farm payrolls fell by 131k, though private payrolls grew 71k; the number of temporary census workers declined 143k, so ex-census, NFP rose 12k

from the household survey, the unemployment rate was unchanged at 9.5%, as the number of people unemployed fell 24k, but the # of employed fell even more, by 159k, and the number of people not-in-the-labour-force grew by 381k... which leads to the statistic that matters most, the % of the population that is working has fallen for the third straight month to 58.4%, above only December's level of 58.2%, and otherwise as low as it has been in 27 years:


chart from zero hedge

Thursday, August 5, 2010

Stocks3: the futility of forward operating earnings estimates

As per an earlier post, the S&P 500 has bounced around in a very wide range in the last decade, from as high as 1576 to as low as 666. It is currently trading at about 1125, which is almost exactly in the mid-point of that range.

Recent index levels therefore provide little guidance regarding future direction: one might as well assume that stocks could tend towards their recent lows as to trend towards their past highs.

What is required, therefore, is a reliable measure of valuation.

Based on a price of 1125 and trailing-year operating earnings of $72.50, the market is trading at a price-to-earnings multiple (P/E Op) of 15.5. This compares favourably to the historical median P/E Op (using operating earnings data available since 1988) of 18.3 (i.e. the market appears to be 15% undervalued relative to this valuation norm since 1988).

Furthermore, based on forward operating earnings estimates of $82.77 for next year and $95.87 for the following year, the forward P/E Op of 13.6 and the 2-year forward P/E Op of 11.7 both suggest that the S&P 500 currently represents good value.

However, based on forward earnings estimates, the S&P seems always to represent good value! (irrespective of its price level). Since the end of 2005, the forward P/E has consistently been around 15 and the 2-year forward P/E around 13. At no time did those "valuation indicators" remotely suggest the possibility of either a price decline of 50%, nor, for that matter, of a rally of 80%.

Despite operating earnings having already risen 43% from their 2009 trough, analysts are projecting earnings growth of 14% in the coming year and 16% in the following year, for a cumulative rise of 32% over the next two years (and a rise of 89% from the trough).

The expectation of earnings of over $95 would eclipse the 2007 high of $91 --- which was established at a time when corporate profits accounted for their highest proportion of GDP since 1949; profit margins were historically very high; the economy, and particularly the financial sector, were excessively leveraged; unemployment was under 5%; retail sales were up over 5% year-over-year and establishing their peak level (5% above the level sales are currently at); when housing starts were double the current level and housing prices had just started to deflate; household net worth was at a record high, etc. All this is simply to suggest that analysts’ expectations are apparently predicated on a return to 2007-type economic “norms”.

In any case, analysts have established an un-enviably poor track record of projecting earnings. The following chart shows at each month-end over the last five years the level of trailing operating earnings and, at the same point in time, analysts’ estimates on a going-forward basis of forward and following year earnings.

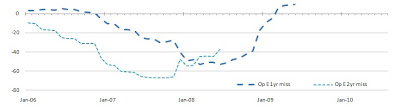
While from the above it is clear that analysts have a tendency to simply “scale-up” the existing level of earnings, the following chart more clearly demonstrates how unreliable analyst forecasts have been (even for operating earnings, much less reported earnings). For instance, 3 years ago, in August 2007, analysts projected forward earnings of $96 and following year earnings of $107, but operating earnings as of August 2008 were under $70 and for August 2009 were under $40.
Furthermore, operating earnings have become further and further divorced over time from companies’ total reported earnings. In fact, the ratio of forward operating earnings to revenues is now higher than it has ever been. As John Hussman has said:

“Ultimately, the value of any security is the properly discounted stream of cash flows that the security will deliver into the hands of investors over time. It is very convenient for Wall Street to operate on the basis of "operating earnings" - which aren't even defined under Generally Accepted Accounting Principles (GAAP) - because this measure of earnings is detached from any need to properly deal with portions of earnings that are lost to writeoffs, "extraordinary" losses, option grants to insiders, and so forth. Yes, these items appear in net earnings, but to most analysts, it is apparently unimportant if companies repeatedly write off previously reported "earnings" as losses, or quietly divert them to incentive compensation - all of that is water under the bridge even if it occurs quarterly.”


So, though one may feel tempted to use operating earnings and operating earnings estimates as a guide for the sake of determining stock market valuation, one must recognize the flaws with such an approach given both the awful track record of analysts' earnings estimates and the significant and growing deviation between operating earnings and the true level of earnings available to shareholders.

Stocks2: S&P earnings growth

In an earlier post I showed that over the long-term, 10-year inflation-adjusted price returns for the S&P 500 and DJIA averaged low single-digits. However, that final chart was the only one I showed on a real basis; all else was shown on a nominal basis.

So, lest I be accused of throwing in an apple with a bunch of oranges, I'll show the comparable chart on a nominal basis here:


So, the picture looks little different: about 2% higher on a nominal basis, unsurprisingly, than on a real (inflation-adjusted) basis.


Another potential criticism of the previous post is that I used NIPA Corporate Profits as a proxy for S&P 500 earnings. Of course, these are two different entities, so may not bear a consistent relationship to each other. So, to redress that problem, I'll look at S&P earnings directly.

The point I was making in the last post is that corporate profit growth should and would, over the long haul, regress to approximately the same level as nominal GDP growth. I showed that with NIPA corporate profits that this was historically the case.

As the following chart shows, though there were deviations at times, S&P earnings growth has been reasonably well-correlated with NIPA corporate profit growth:

More to the point, as the following chart shows, S&P earnings growth has not generally kept pace with nominal GDP growth:

While there were certainly periods like the 1990s and 2000s when S&P earnings grew faster than GDP as profit margins improved, on average, the periods when S&P earnings growth trailed GDP growth dominated the periods when the converse was true.

So, to reiterate, to believe that stock prices should grow faster than nominal GDP growth is to believe either that corporate earnings growth can grow sustainably faster than GDP, which is contrary to historical evidence, and/or that P/E multiples will continuously expand, a topic that will be examined in a later post.

August 5

The biggest lie about U.S. companies. Brett Arends, MarketWatch.

Wednesday, August 4, 2010

August 4

other fare:
Monsanto: The world's poster child for corporate manipulation and deceit. The New America Republic.

In spite of great losses and unreliable yields, Monsanto has skillfully eliminated the availability of non-GM cotton seeds in many regions throughout India, forcing farmers to buy their varieties.

Farmers borrow heavily and at high interest rates to pay four times the price for the GM varieties, along with the chemicals needed to grow them. When Bt cotton performs poorly and can't even pay back the debt, desperate farmers resort to suicide, often drinking unused pesticides. In one region, more than three Bt cotton farmers take their own lives each day. The UK Daily Mail estimates that the total number of Bt cotton-related suicides in India is a staggering 125,000....

A greater tragedy may be the harm from the dangerous GM foods produced by Monsanto. The American Academy of Environmental Medicine (AAEM) has called on all physicians to prescribe diets without GM foods to all patients.(43) They called for a moratorium on GMOs, long-term independent studies, and labeling. They stated, "Several animal studies indicate serious health risks associated with GM food," including infertility, immune problems, accelerated aging, insulin regulation, and changes in major organs and the gastrointestinal system. "There is more than a casual association between GM foods and adverse health effects. There is causation"

Monday, August 2, 2010

August 2

Valuing the S&P 500 Using Forward Operating Earnings. John Hussman.

stocks are a claim to a long-term stream of cash flows that will actually be distributed to investors over time, and that this stream of cash flows cannot be estimated from a single year's earnings number. The main reason for this is that profit margins vary from year-to-year over the business cycle, and tend to mean-revert over the long-term. Earnings (net and operating) tend to be depressed during periods of economic strain, but when they reflect compressed profit margins, they are strongly associated with above-average rates of subsequent growth over the following 7-10 years. In contrast, earnings that reflect elevated profit margins are strongly associated with poor rates of subsequent growth. When analysts take earnings figures at face value, and presume to "capitalize" them simply by dividing by interest rates, they demonstrate a Kindergartener's grasp of securities valuation......

the market was moderately, but not historically undervalued, at the 2009 low, which briefly approached the level of valuation that was observed at the 1970 low, but was nowhere close to the valuations seen at points such as 1950, 1974 and 1982. I clearly underestimated the willingness of investors to drive stocks back to strenuous overvaluation so quickly. Earlier this year, the market was more overvalued than at any point prior to the late-1990's bubble, and is currently near the same level of overvaluation as the 1972 and 1987 market peaks. At present, ... the S&P 500 is most likely priced to deliver a 10-year total return of roughly 6%, albeit with the likelihood of significant interim volatility. Stocks are emphatically not cheap on a historical basis.


Defining prosperity down. Paul Krugman, NYT.